CBI Index 2025Q3 Released by the National School of Development, Peking University
China Online Consumer Brand Index (CBI) (2023-2025Q3)
Encouraging innovation and healthy competition is essential for achieving high-quality development. The “China Online Consumer Brand Index” is the first online consumer index dedicated to benchmarking high-quality development. This index was jointly developed by the National School of Development at Peking University, the Digital Finance Research Center at Peking University, and the Business School of Sun Yat-sen University, with support from Alibaba’s Taobao and Tmall Group.
This index comprehensively measures consumption quality and brand equity based on underlying metrics such as sales, prices, search volume, and customer reviews. Leveraging big data, it evaluates brands’ equity and tracks changes in consumption quality through the average score of a “basket” of consumer brands. It complements traditional macroeconomic indicators like total retail sales and the consumer price index (CPI) by adding the quality dimension of consumption. Additionally, it provides valuable insights to guide brand development and business strategies in the China market.
The CBI Index has three components:
(1) China Online Consumer Brand Index (CBI): This captures the average consumption quality levels across different product categories in prefecture-level cities.
(2) China Online Brand Purchase Index (BPI): This highlights the relative purchasing power for top-rated brands across prefecture-level cities.
(3) China Top 500 Online Consumer Brands List (CBI500): This ranks the top 500 online consumer brands entirely based on actual consumer purchasing behaviors, intending to guide brand’s development and promote healthy competition in the e-commerce market.
Brand Rating and Index Methodology
As the world’s largest online retail market, China’s e-commerce market not only creates new opportunities for brand development but also serves as a dynamic basis for macroeconomic analysis.
The CBI leverages big data from online consumption. Brand ratings are derived from multiple online consumption metrics, with higher scores indicating higher quality, stronger consumer preference, and growth potential. The top-performing brand in each product category is standardized to a score of 100, while unbranded products receive a score of 0. The CBI is the average rating of a “basket” of consumer brands, with higher scores indicating higher overall consumption quality. The total score of this same “basket” corresponds to another index, the BPI, where higher scores represent stronger purchasing power. By limiting the “basket” of brands to specific quarterly time frames, sectors, or regions, it becomes possible to generate indexes for particular time frames × product categories × region combinations.
The scoring system evaluates four key dimensions: Brand Awareness (32.5%), Brand Novelty (27.5%), Customer Loyalty (22.5%), and Customer Satisfaction (17.5%), encompassing a total of 12 underlying metrics. The relative weights of these dimensions are determined using a subjective weighting method, where an expert panel independently assigns weights, and the average of their evaluations is used as the final weighting. Within each dimension, the relative weights of individual metrics are calculated using the coefficient of variation method.
Brand Novelty is a metric typically not included in traditional rating systems but has the second-highest weighting in our brand rating system. This reflects a focus on identifying brands demonstrating rapid growth, strong appeal to younger consumers, and a commitment to product innovation. The approach is especially favorable to emerging brands that are creative, which resonates with the dynamic nature of China’s e-commerce market.
Trend Analysis
In the third quarter of 2025, the CBI reached 62.65, an increase compared to the third quarter of the previous year but a decrease from the second quarter of the same year. This change follows the pattern consistent with the past two years, where the CBI is typically higher in the second and fourth quarters and relatively lower in the first and third quarters. This is largely because major shopping festivals such as the “6.18 Shopping Festival” and “11.11 Shopping Festival” have become key periods for brand consumption. Consumers often time their purchases of branded products during these festivals, which naturally results in lower CBI values in the third quarter compared to the second and fourth quarters.
Compared to the third quarter of 2024, the CBI showed a year-on-year increase of 0.92%, continuing the growth trend in high-quality consumption since 2023. If the first quarter of 2023, the starting period of the first report, is set as the base period with an index value of 100, then subsequent index values can be calculated relative to this baseline. According to this calculation, the CBI in the third quarter of 2025 increased by 5.4% compared to the base period.
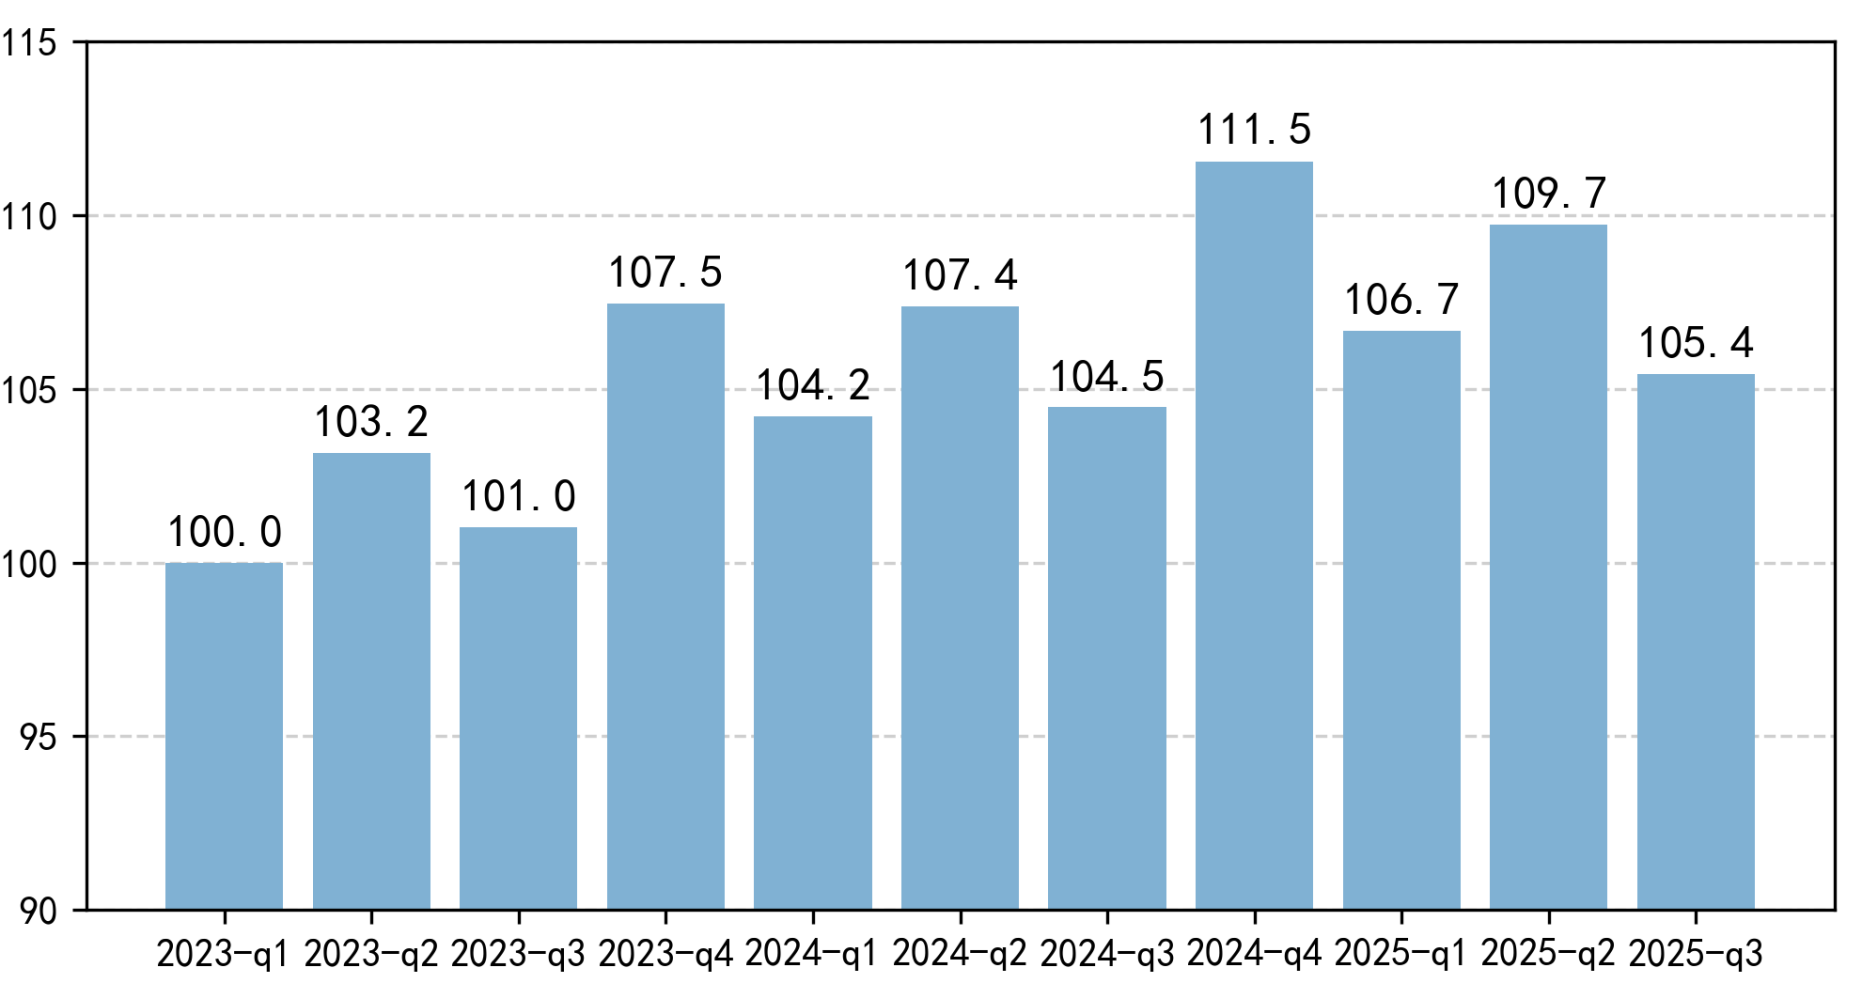
Figure 1. CBI
(Using Q1 2023 as the Base Period, Base Index = 100)
Industry Comparison
The CBI shows significant differences in both absolute values and growth dynamics across industry categories. A higher CBI indicates a greater concentration of sales among leading brands and fewer unbranded products, while a lower CBI suggests an opportunity for brands to enter and compete. When an industry’s CBI shows an upward trend, it signals either the gradual formation of leading brands or sales consolidation among existing leading brands.
Consistent with previous reports, 3C (mobile phones, smart devices and other digital products), home appliances, beauty products, and sports & outdoors exhibit higher CBI values. In these industries, consumers have higher demands for product quality and functionality, along with a stronger sense of brand awareness. The industries with the highest quarter-on-quarter CBI growth are women’s wear and office & school supplies, with the latter largely influenced by the back-to-school season. To minimize the impact of shopping festivals, this report compares industry scores with the third quarter of 2024. Industries that maintained year-on-year growth include women's wear, 3C smart devices, beauty products, sports & outdoors, pet care, men’s wear, and home furnishing & home decos. The year-on-year growth in women's wear may be related to Taobao’s operational strategies, which have increased support for original clothing brands.
In the 3C digital sector, some divergence has emerged. While categories such as smart devices continued to show positive growth, mobile phones (3C Communications) and laptops (3C Culture & Education) experienced fluctuations. This is partly due to the dominance of major brands in the sector, as relevant consumer spending often peaks during shopping festivals, leading to variations in third-quarter index values. The CBI for collectibles declined year-on-year, reflecting the dynamic nature of the industry, as the emergence of blockbuster IP products is highly unpredictable. Similarly, the food industry’s brand index decreased year-on-year, influenced by the seasonality of the alcohol sector and related policy guidance and regulations.
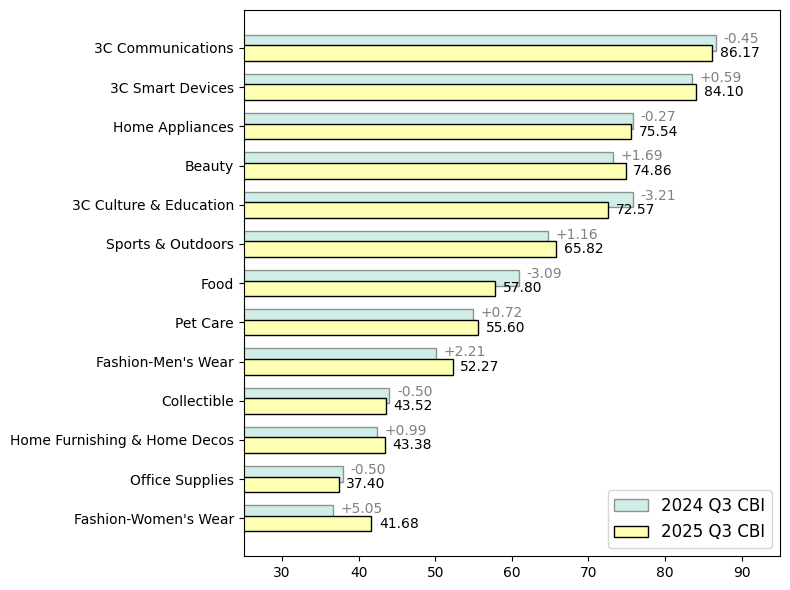
Figure 2. Comparison of CBI by Industry Category
Regional Analysis
In terms of regional rankings, the CBI shows that the top ten cities are predominantly second- and third-tier cities, such as Hefei in Anhui Province, Zhengzhou in Henan Province, and Nanchang in Jiangxi Province. Other cities making it into the CBI Top 10 this quarter include Sansha (Hainan Province), Harbin (Heilongjiang Province), Lianyungang (Jiangsu Province), and Urumqi (Xinjiang Uygur Autonomous Region). Among these, Harbin, Lianyungang, and Urumqi serve as regional hubs or are located in economically developed areas. Sansha has benefited from ongoing logistics enhancements to effectively connect with e-commerce supplies, which have fueled fresh demand for sustained upgrades in consumption quality. Additionally, Sansha’s small population base, coupled with the fishing moratorium in Q3, contributed to a noticeable spike in its index performance.
For the BPI, first-tier cities like Beijing, Shanghai, Guangzhou, and Shenzhen continue to dominate the top rankings. The remaining top ten cities are mostly emerging first-tier cities. Across both dimensions—CBI and BPI—Shanghai, Wuhan, and Nanjing, consistently ranked in the national top ten.
Table 1: Top Ten Cities in the Brand Index Series
Newest: 2025Q3 |
Comparison: 2025Q2 |
||
CBI Top 10 (Q3 2025) |
BPI Top 10 (Q3 2025) |
CBI Top 10 (Q2 2025) |
BPI Top 10 (Q1 2025) |
Sansha |
Shanghai |
Hefei |
Shanghai |
Harbin |
Beijing |
Zhengzhou |
Beijing |
Hefei |
Shenzhen |
Nanjing |
Hangzhou |
Zhengzhou |
Guangzhou |
Nanchang |
Guangzhou |
Nanchang |
Hangzhou |
Huai'an |
Shenzhen |
Nanjing |
Chengdu |
Hangzhou |
Chengdu |
Wuhan |
Suzhou |
Wuhan |
Suzhou |
Lianyungang |
Chongqing |
Linyi |
Chongqing |
Urumqi |
Wuhan |
Huaibei |
Wuhan |
Shanghai |
Nanjing |
Zhoukou |
Nanjing |
The top five brands in the ranking are Apple, Xiaomi(小米), Midea(美的), Huawei(华为), and Haier(海尔), remaining largely consistent with the previous quarter. Midea and Haier, which benefited from summer air conditioning sales, experienced a slight decline in influence during the third quarter, with their rankings sliding from second and fourth in Q2 to third and fifth in Q3, respectively. Xiaomi, with its diversified multi-industry operations, maintained relatively stable rankings across quarters.
Other fast-growing brands fall into three key categories: (1) smart device brands, represented by DJI (大疆); (2) food brands tied to the Mid-Autumn Festival; and (3) office & school supplies brands associated with the back-to-school season. In the 3C smart devices category, DJI broke into the top 10 this quarter, thanks to its focus on and innovation in niche markets for action cameras and drones. For instance, DJI enhanced the user experience by introducing features like subject tracking and variable apertures, tailored to specific scenarios such as travel, cycling, diving, and skiing. These highly specialized products effectively met consumer needs in segmented markets.
In the food category, brands like Guangzhou Restaurant (广州酒家), MRSCRAB (蟹太太), Jiahua Food (嘉华), Maxim’s (美心), and Daoxiangcun (稻香村) saw notable ranking increases, largely driven by seasonal Mid-Autumn Festival consumption as demand surged for products such as mooncake gift boxes, pastries, and seasonal fresh goods.
In the office & school supplies category, leading brands like Deli (得力) and M&G (晨光) have long maintained dominant positions. Meanwhile, several emerging brands saw notable ranking improvements in Q3. For instance, Zuoyebang (作业帮) entered the educational hardware market with products such as smart learning devices. This move, combined with the seasonal back-to-school demand, resulted in a significant boost to its ranking. Additionally, Caran·Y (卡拉羊) improved its position by focusing on school bags for primary and secondary school students (a high-frequency demand category), with “load reduction and anti-sagging” as its core product features. It segments products by height and academic stage (covering kindergarten, lower grades and high school), launching product lines tailored to different body types, which led to a more notable ranking increase during the back-to-school season.
Table 2: CBI500 (Top 50)
Rank |
Brand |
Category |
|
1 |
苹果 |
Apple |
3C Digital |
2 |
小米 |
Xiaomi |
3C Digital |
3 |
美的 |
Midea |
Home Appliances |
4 |
华为 |
HUAWEI |
3C Digital |
5 |
海尔 |
Haier |
Home Appliances |
6 |
联想 |
Lenovo |
3C Digital |
7 |
耐克 |
NIKE |
Sports & Outdoors + Fashion |
8 |
源氏木语 |
YESWOOD |
Home Furnishing & Home Decos |
9 |
李宁 |
LI-NING |
Sports & Outdoors + Fashion |
10 |
大疆 |
DJI |
3C Digital |
11 |
阿迪达斯 |
adidas |
Sports & Outdoors + Fashion |
12 |
泡泡玛特 |
POP MART |
Collectible |
13 |
林氏家居 |
LINSY |
Home Furnishing & Home Decos |
14 |
优衣库 |
UNIQLO |
Sports & Outdoors + Fashion |
15 |
安踏 |
ANTA |
Sports & Outdoors + Fashion |
16 |
斐乐 |
FILA |
Sports & Outdoors + Fashion |
17 |
得力 |
deli |
Office & School Supplies |
18 |
周大福 |
Chow Tai Fook |
Jewelry & Accessories |
19 |
无印良品 |
MUJI |
Sports & Outdoors + Fashion |
20 |
维沃 |
vivo |
3C Digital |
21 |
苏泊尔 |
SUPOR |
Home Appliances |
22 |
爱他美 |
Aptamil |
Food |
23 |
公牛 |
BULL |
Home Furnishing & Home Decos |
24 |
\ |
Babycare |
Household Items |
25 |
欧莱雅 |
L’ORÉAL |
Beauty |
26 |
雅诗兰黛 |
ESTĒELAUDER |
Beauty |
27 |
兰蔻 |
LANCÔME |
Beauty |
28 |
猫人 |
MiiOW |
Sports & Outdoors + Fashion |
29 |
圣罗兰 |
YSL |
Beauty |
30 |
回力 |
Warrior |
Sports & Outdoors + Fashion |
31 |
华硕 |
ASUS |
3C Digital |
32 |
九号电动 |
ninebot |
Transportation |
33 |
维达 |
Vinda |
Household Items |
34 |
雀巢 |
Nestle |
Food |
35 |
格力 |
Gree |
Home Appliances |
36 |
美素佳儿 |
Friso |
Food |
37 |
百丽 |
BELLE |
Sports & Outdoors + Fashion |
38 |
骆驼 |
CAMEL |
Sports & Outdoors + Fashion |
39 |
伊利 |
Yili |
Food |
40 |
/ |
UR(URBAN REVIVO) |
Sports & Outdoors + Fashion |
41 |
香奈儿 |
CHANEL |
Beauty |
42 |
剑南春 |
JianNanChun Chiew |
Food |
43 |
斯维诗 |
swisse |
Medical/Healthcare/Nutritional Products |
44 |
珀莱雅 |
PROYA |
Beauty |
45 |
小牛电动 |
niu |
Transportation |
46 |
巴拉巴拉 |
balabala |
Sports & Outdoors + Fashion |
47 |
海蓝之谜 |
LA MER |
Beauty |
48 |
蕉下 |
Beneunder |
Sports & Outdoors + Fashion |
49 |
茅台 |
Moutai |
Food |
50 |
索尼 |
SONY |
3C Digital |
This quarter's index series shows that high-quality brand consumption in China’s online retail market has continued to grow year-on-year. Several brands in categories such as 3C smart devices, office and school supplies, and food performed particularly well, driven by the expansion of the smart device industry, seasonal back-to-school demand, and Mid-Autumn Festival-related consumption. These findings provide valuable insights into China’s consumption trends and offer guidance for brand innovation and development.
Attached:China Online Consumer Brand Index(2023-2025Q3)Full Report
Attached:CBI500 (2025Q3)